In this chapter we will discuss about : "Trend is your friends , trendline and channel line "
1. Trend Is Your Friends
Trends are very easy to see on a chart. They are seen best over a long time period—weeks, months, and years. If prices are going up, the trend is up and if the prices are going down, the trend is down. But, If prices go up and then down, is the trend up or down? The answer is “yes.” The prices going up in the long term, over the period of the entire chart, but down in the shorter term, the last two years.
One standard definition of an uptrend is a succession if higher highs and higher lows. The trend can be considered intact until a previous reaction low point is broken. The violation of this condition indicates a warning signal that the trend may be over. It should be emphasized, however, that the disruption of the pattern of higher highs and higher lows (or lower highs and lower lows) should be viewed as a clue, not a conclusive indicator, of a possible long-term trend reversal. Uptrends and downtrends are often defined in terms of trend lines. An uptrend line is a line that connects a series of higher lows, while a downtrend line is a line that connects a series of lower highs.
A trend exits when prices keep rising or falling over time. In an uptrend, each rally reaches a higher high than the preceding rally and each decline stops at a higher level than the preceding decline. In a downtrend each decline falls to a lower low than the preceding decline and each rally stops at a lower level than the preceding decline and each rally stops at a lower level than the preceding rally. The trend is always a matter of time interval. Even over a few days, two traders may see the same market as going in different directions. Each one can make money or lose money within the same period by correctly or incorrectly deciding where to buy and where to sell.
2. Trendline and Channel line
Trend lines and channels are useful, but their importance is often overstated. It is easy to overestimate the reliability of trend lines when they are drawn with the benefit of hindsight. A consideration that is frequently overlooked is that trend lines often need to be redrawn as a bull or bear market is extended. Thus, although the penetration of a trend line will sometimes offer an early warning signal of a trend reversal, it is also common that such a development will merely require a redrawing of the trend line.
The following rules are usually applied to trend lines and channels:
1. Declines approaching an uptrend line and rallies approaching a downtrend line are often good opportunities to initiate positions in the direction of the major trend.
2. The penetration of an uptrend line (particularly on a closing basis) is a sell signal; the penetration of a downtrend line is a buy signal. Normally, a minimum percentage price move or a minimum number of closes beyond the trend line is required to confirm a penetration.
3. The lower end of a downtrend channel and the upper end of an uptrend channel represent potential profit-taking zones for short-term traders.
** Trendline **
Trend lines are a simple and widely used technical analysis approach to judging entry and exit investment timing. To establish a trend line historical data, typically presented in the format of a chart such as the above price chart, is required. Historically, trend lines have been drawn by hand on paper charts, but it is now more common to use charting software that enables trend lines to be drawn on computer based charts. There are some charting software that will automatically generate trend lines, however most traders prefer to draw their own trendlines.
Trendlines have two major uses.They allow identification of support and resistance levels that can be used, while a market is trending, to initiate new positions. As a rule, the longer a trendline has been in effect and the more times it has been tested, the more significant it becomes.The violation of a trendline is often the best warning of a change in trend.You can draw a trendline with two points, but three or four are even better.
This trendlines are divided into 3 parts :
A. Uptrend
When you seen uptrend, it mean that the market is dominated by buyers, and the price going higher and higher until the the buyers lose the control and sellers start push it down.An uptrend is formed by connecting the lowest rising prices.

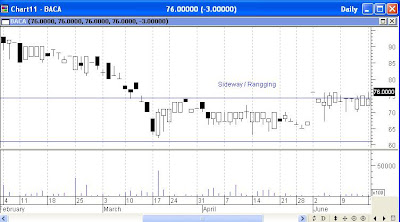
B. Sideway / Rangging trend
Mean that during that certain periods, the power of buyers and sellers are the same.To draw this trend just find the trend that move back and fourth with smaller power from buyers or sellers. This mean there is an indecision in market, so prepare yourself because this trend will go up or down soon.

C. Downtrend
When you seen downtrend, it mean that the market is dominated by sellers, and the price going lower and lower until the the sellers lose the control and buyers start push it up. An downtrend is formed by connecting the lowest rising prices.

** Channel Line **
Channel lines are straight lines that are drawn parallel to basic trendlines. A rising channel line would be drawn above the price action and parallel to the basic trendline (which is below the price action). A declining channel line would be drawn below the price action and parallel to the down trendline(which is above the price action).


Tidak ada komentar:
Posting Komentar